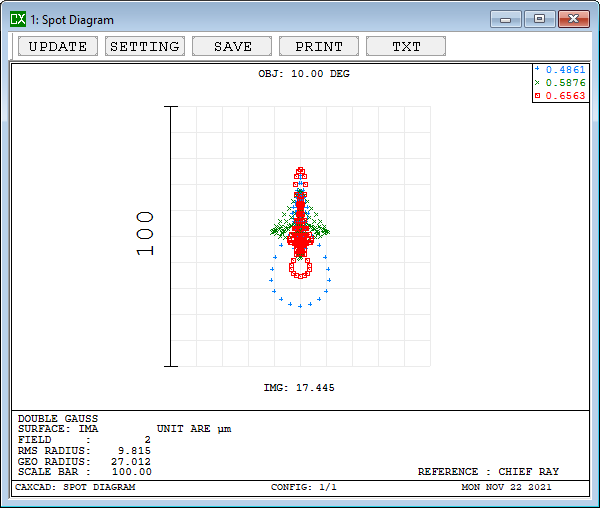
Spot diagrams are graphs that show where rays from a point object will fall on the image surface.
The spot diagrams are maps of where rays intersect the image plane after passing through the pupil with a chosen grid pattern. A spot diagram can be considered to be an image of a point source.
Here is one example:
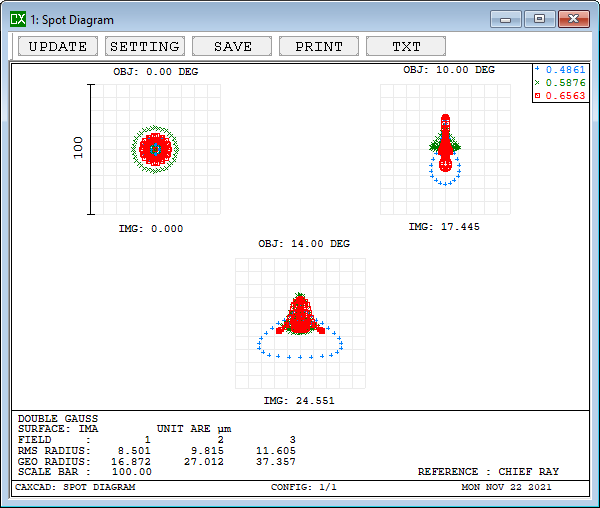
To generate these diagrams we trace a large number of rays, typically of the order of 100, from each field point, and often in several colors.
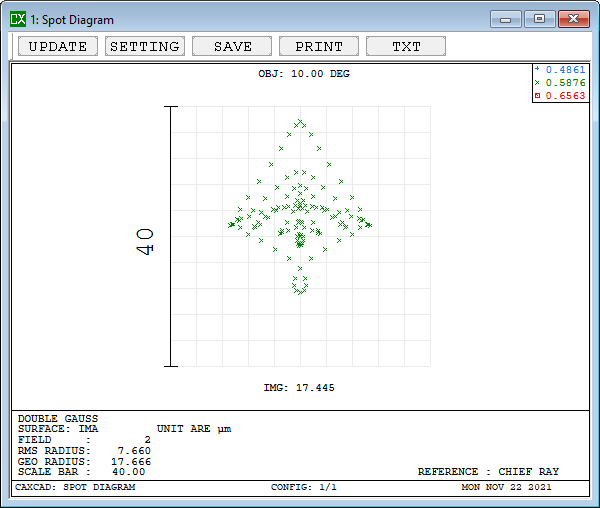
Spot Diagram for single wavelength
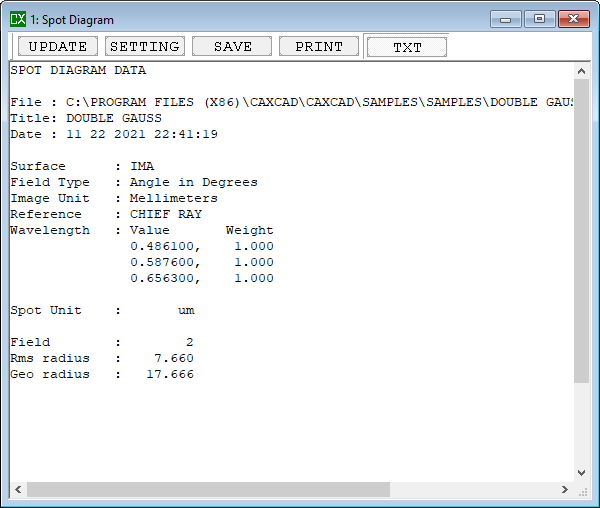
Spot Diagram Data